WMO IG3IS & Anthropogenic Sulfur Inventories
Global SO2 Trajectories & Urban CO2 Bayesian Inversions
1. Paris Bayesian CO2 Inversion Architecture (WMO IG3IS Lineage)
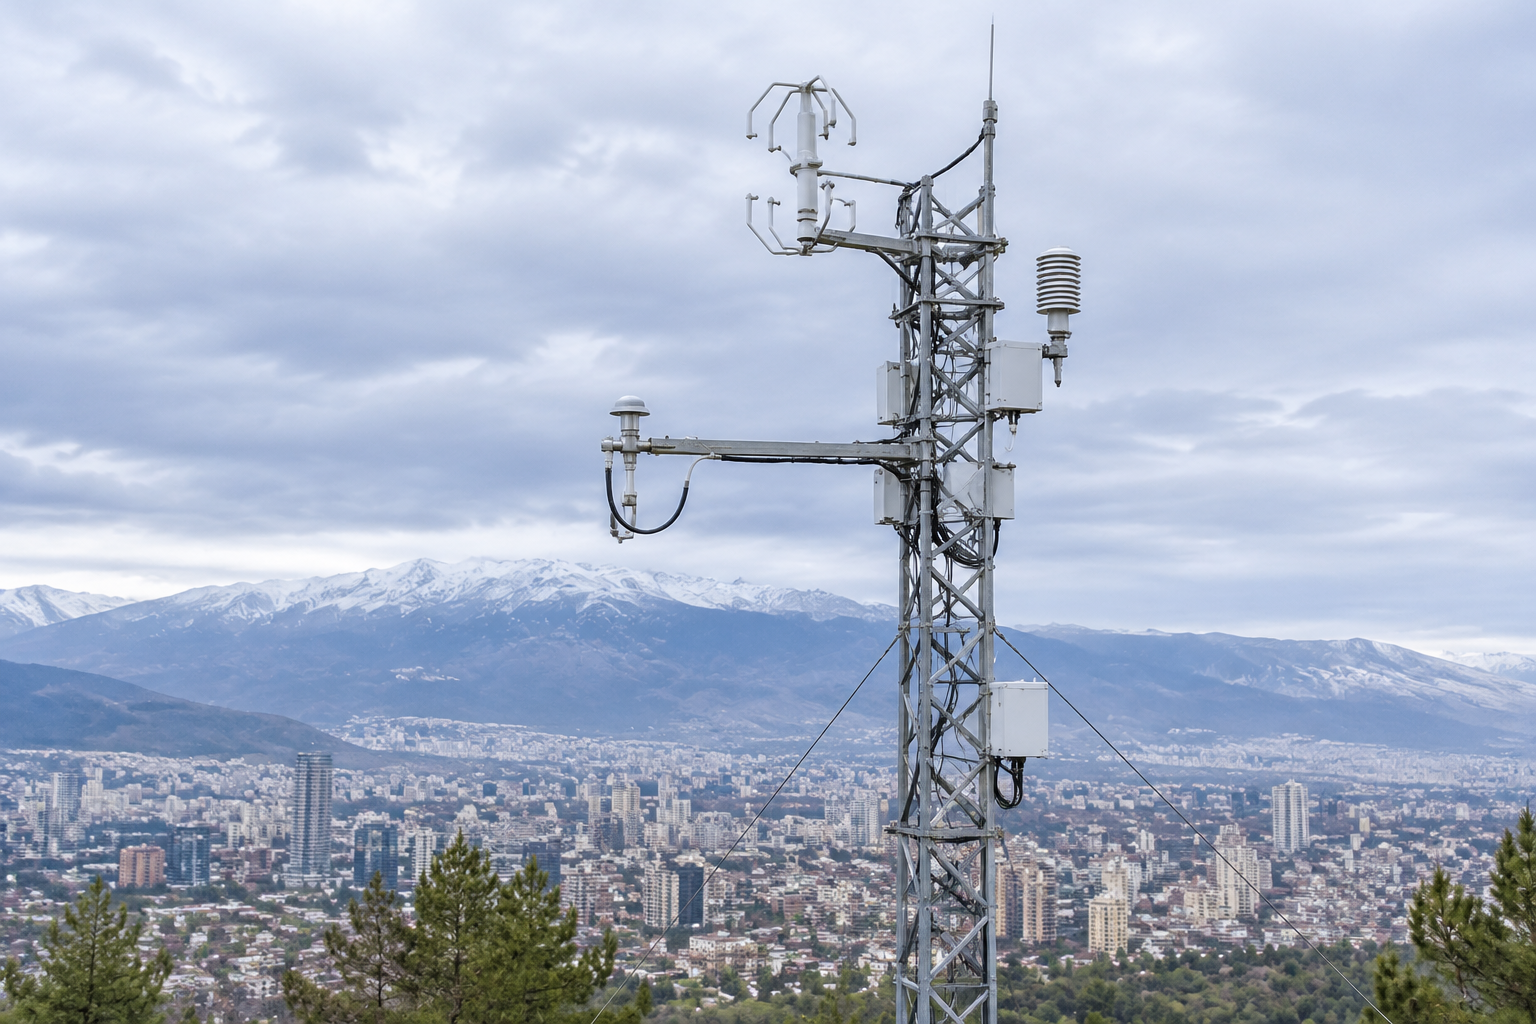
Evaluating fossil CO2 budgets across metropolitan Paris (Breon et al., 2015, cited in WMO IG3IS) combines a 2 km mesoscale transport model with Airparif prior inventories and ecosystem biogenic fluxes solved at 6-hour steps. Model-observation comparisons across five sites reveal two structural constraints for urban greenhouse gas monitoring:
Interactive Urban Inversion Assimilation Selector
2. Global Anthropogenic Sulfur Dioxide Inventory (1850-2005)
Long-term climate radiative forcing depends on sulfate aerosols formed from sulfur dioxide oxidation. Using country-calibrated bottom-up mass balances (Smith et al., 2011), annual emissions distributed onto a 0.5-degree sectoral grid capture the early-1970s global peak, subsequent reductions in North America and Europe through 2000, and renewed post-2000 growth driven by East Asian coal combustion and international shipping.
| Inventory Approach | Spatial / Temporal Resolution | Primary Error Source | Verified Diagnostic Outcome |
|---|---|---|---|
| Bottom-Up SO2 Mass Balance (1850-2005) | 0.5 deg grid · Annual sectoral | Coal sulfur content & FGD scrubbing rates | Regional uncertainty up to 30% (China & shipping dominate recent spread) |
| Bayesian Urban CO2 Inversion (Paris) | 2 km transport · 6 h flux adjustment | Distant boundary inflow & urban-core turbulence | Upwind-downwind gradients reveal Airparif prior overestimate over 30-day windows |
Historical Citation Archive
Breon et al. (2015): Estimating Paris area CO2 emissions from atmospheric measurements
Applied a 2 km Bayesian atmospheric inversion over five Paris-region monitoring sites (including the Eiffel Tower) against Airparif priors at 6-hour temporal steps. Demonstrated that assimilating upwind-downwind edge gradients substantially reduces boundary-inflow uncertainty and identifies systematic Airparif inventory overestimates across two 30-day evaluation periods. Canonical DOI: https://doi.org/10.5194/acp-15-1707-2015.
Smith et al. (2011): Anthropogenic sulfur dioxide emissions: 1850-2005
Constructed annual bottom-up mass-balance global and regional SO2 emissions from 1850 through 2005 on a 0.5-degree sectoral grid for climate model experiments. Documented the early-1970s global peak, decline to 2000, subsequent increase driven by East Asia and shipping, and regional uncertainty bounds up to 30%. Canonical DOI: https://doi.org/10.5194/acp-11-1101-2011.